Business Intelligence (BI) Tool in Smart Navigator: The Unified View of Organizational Insight
One truth across dashboards, reports, and decision layers.
Nov 18, 2025
A manager opens three dashboards from three different systems. A data analyst waits for yesterday's Excel export to finish refreshing. An executive asks a simple question and receives five different answers.
Not because the team lacks data, but because the data lacks coherence.
Every organization knows this story. Data exists everywhere, yet rarely speaks the same language. This is exactly the problem Smart Navigator set out to solve.
The Moment Everything Changed
During a deployment workshop with one of our early partners, someone said: "We don't need more dashboards. We need one truth."
That sentence shaped the future of Smart Navigator. We realized a BI tool is useful only if the data underneath it is harmonized, interpreted correctly, and capable of adapting to fast-changing realities.
So we built something different: not just another dashboard engine, but a BI tool powered by dynamic ontology, meaning it continuously understands, restructures, and re-evaluates data relationships as context evolves.
Where Traditional BI Stops, Smart Navigator Begins
Typical BI systems can visualize data. Smart Navigator can interpret it.
That interpretation comes from its dynamic ontology: a semantic map that represents entities, relationships, behaviors, and context.
What does that mean in the real world?
- Data from relational databases enters SN with rigid definitions.
- API streams from third-party tools bring inconsistent formats.
- Operational logs, sensor feeds, documents, and reports all speak their own dialect.
Normally, this creates fragmentation. But SN's dynamic ontology translates them into a unified organizational language. It identifies entities, resolves conflicts, adapts when meaning changes, and feeds all of this into the BI tool in real time.
So instead of asking "Which system has the latest data?", you ask "What is really happening and why?" and Smart Navigator answers.
A BI Tool Built on Top of Living Intelligence
With that foundation, the BI Tool becomes more than dashboards:
- Interconnected intelligence: Every chart, KPI, or report pulls from a harmonized semantic layer, not raw isolated tables.
- Real-time adaptation: When ontology shifts based on new patterns or contextual cues, dashboards update automatically.
- True multi-source integration: SN does not just merge data, it understands it; structured or unstructured, internal or external, static or streaming.
- Business-logic-aligned insights: Executives see strategy indicators, managers see operational performance, analysts see drill-down dimensions.
- Standardized reporting: PDF, Excel, and CSV exports come from one trustworthy source of truth.
In modern organizations, data is scattered across systems, workflows, and operational layers, creating fragmentation that slows decision-making. Smart Navigator addresses this through a unified Business Intelligence (BI) Tool designed for clarity, consistency, and actionable insight.
The BI tool brings together structured analytics, real-time reporting, and role-based visibility to empower executives, managers, and analysts with a complete and trustworthy picture of organizational performance.
A Unified Intelligence Layer
At the core of Smart Navigator's analytics ecosystem, the BI tool acts as a central gateway to enterprise intelligence.
It consolidates insights through the platform's dynamic ontology from streaming sources, relational systems, and external connectors, converting raw information into clear, visual, and meaningful outputs.
Key Capabilities
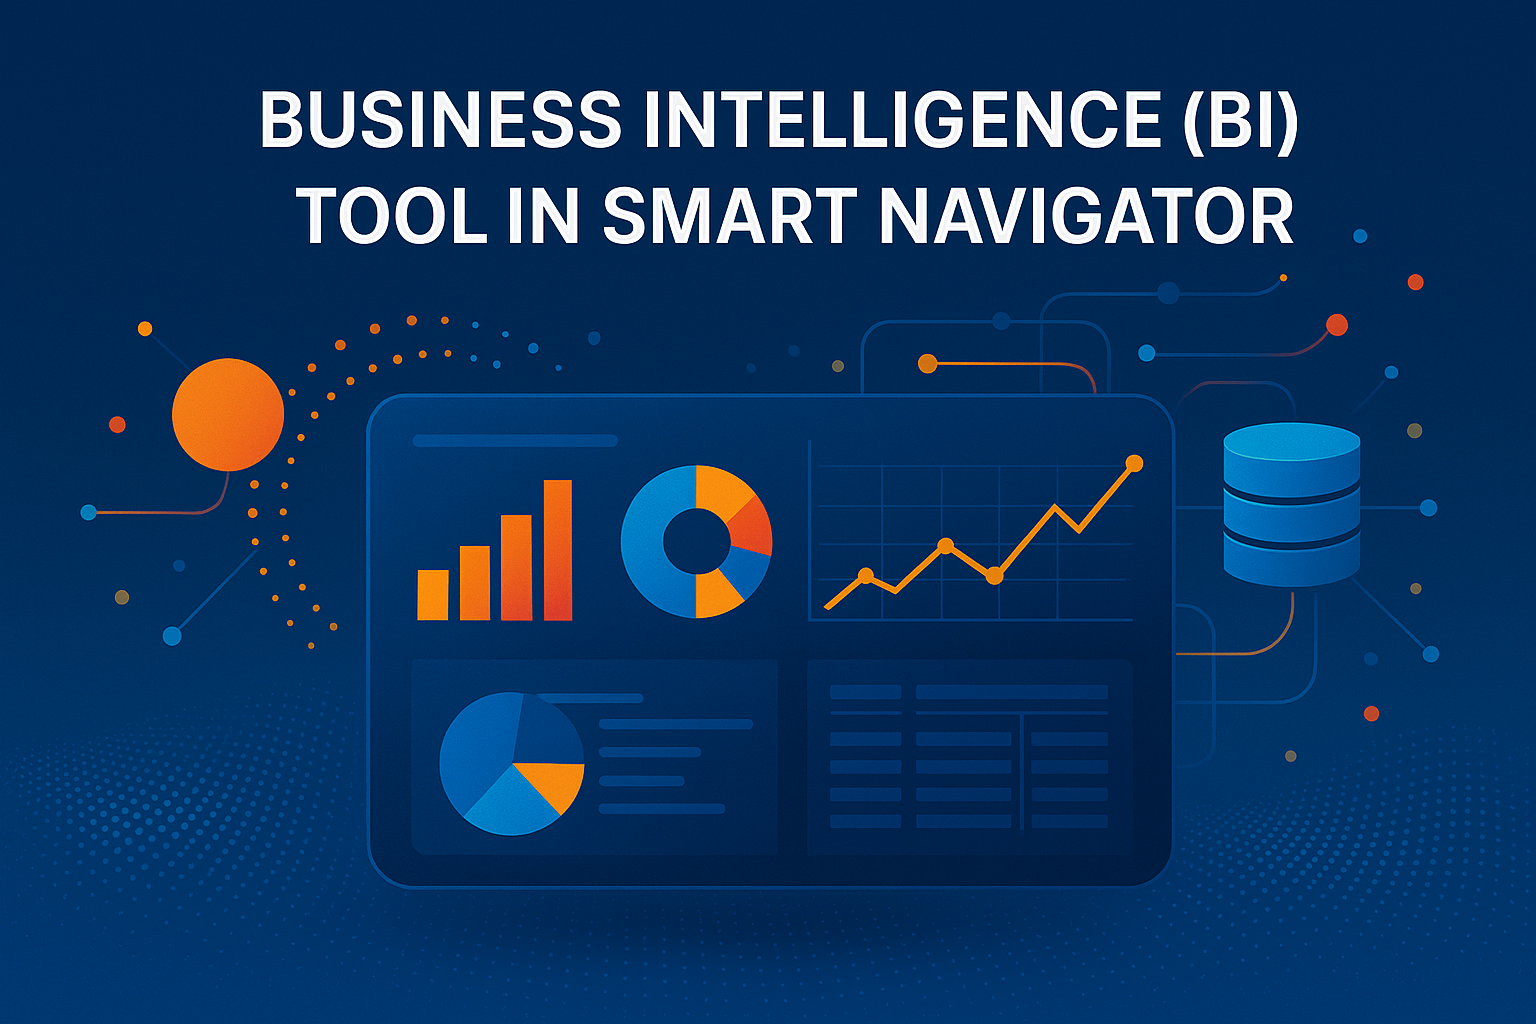
1. Interactive Dashboards
Users can create or access rich, customizable dashboards with charts, graphs, tables, and KPI blocks tailored for strategic or operational monitoring.
2. Multi-Source Data Integration
The BI tool seamlessly merges data through Smart Navigator's dynamic ontology from:
- Streaming data sources
- Relational databases
- Third-party data sources
This creates a coherent and interconnected information space.
3. Standard Reporting & Exporting
Generate reports on demand or automatically on a schedule. Supported formats include PDF, Excel, and CSV.
4. Drill-Down & Filtering
Explore analytics hierarchically from high-level organizational insights down to departments, teams, or specific entities.
5. Role-Based Access
Every dashboard adheres to Smart Navigator's Access Control & Privacy framework, ensuring users only see information they are authorized to access.
Designed for Decision-Makers
The BI tool serves professionals who rely on fast, accurate, and consolidated information:
- Executives seeking full organizational visibility
- Managers tracking performance and progress
- Analysts working with KPIs, trends, and operational indicators
It delivers an enterprise-wide snapshot that is real-time, intuitive, standardized, and decision-ready. Smart Navigator's BI tool ensures organizations don't just collect data; they understand it, act on it, and turn it into strategic advantage.
Posted on: Nov 18, 2025